Support & resistance on the chart
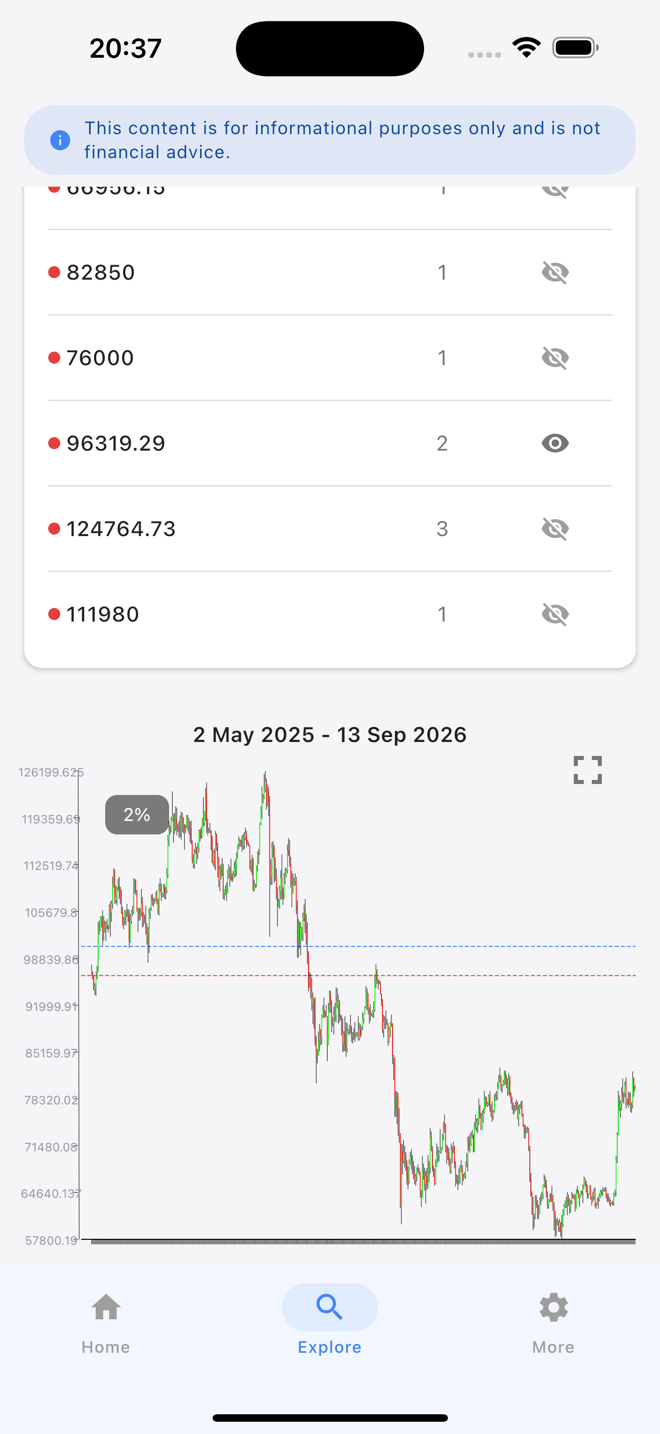
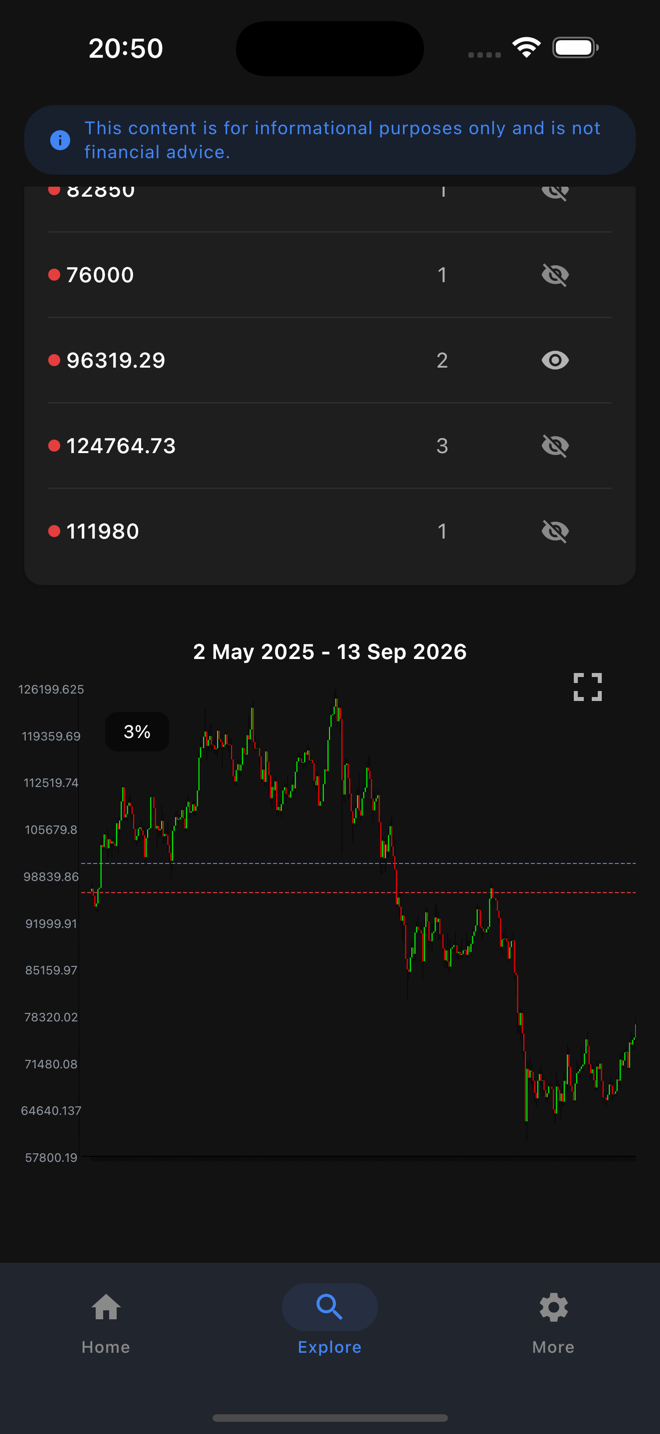
Crypto S&R calculates levels from market data and plots them on the candlesticks. Filter support, resistance, or both, see hit counts, and show or hide individual levels while you study structure.

Crypto Support & Resistance
See key price levels on live candlestick charts, explore thousands of crypto pairs, and keep favorites in a watchlist — a focused charting app for market study.

 Soon
Coming soon — currently in App Store review
Automatic support and resistance on live crypto candlesticks, plus the screens you use every session.
Crypto S&R calculates levels from market data and plots them on the candlesticks. Filter support, resistance, or both, see hit counts, and show or hide individual levels while you study structure.
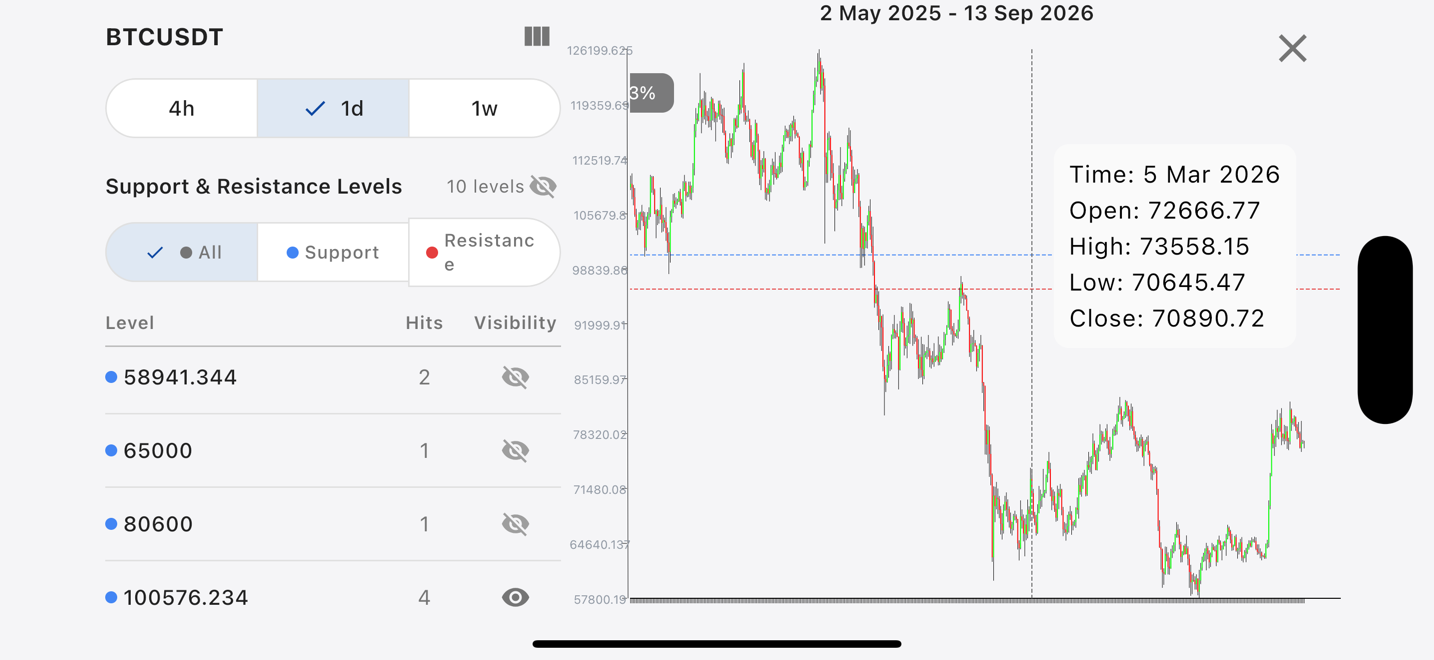
Live candlesticks with 4h, 1d, and 1w views. Pinch to zoom, scroll the history, and long-press for an OHLC readout so you can inspect a candle without leaving the chart.
Search pairs quickly, browse popular tickers, and star coins you follow. Your watchlist sits on Home so the next session starts where you left off.
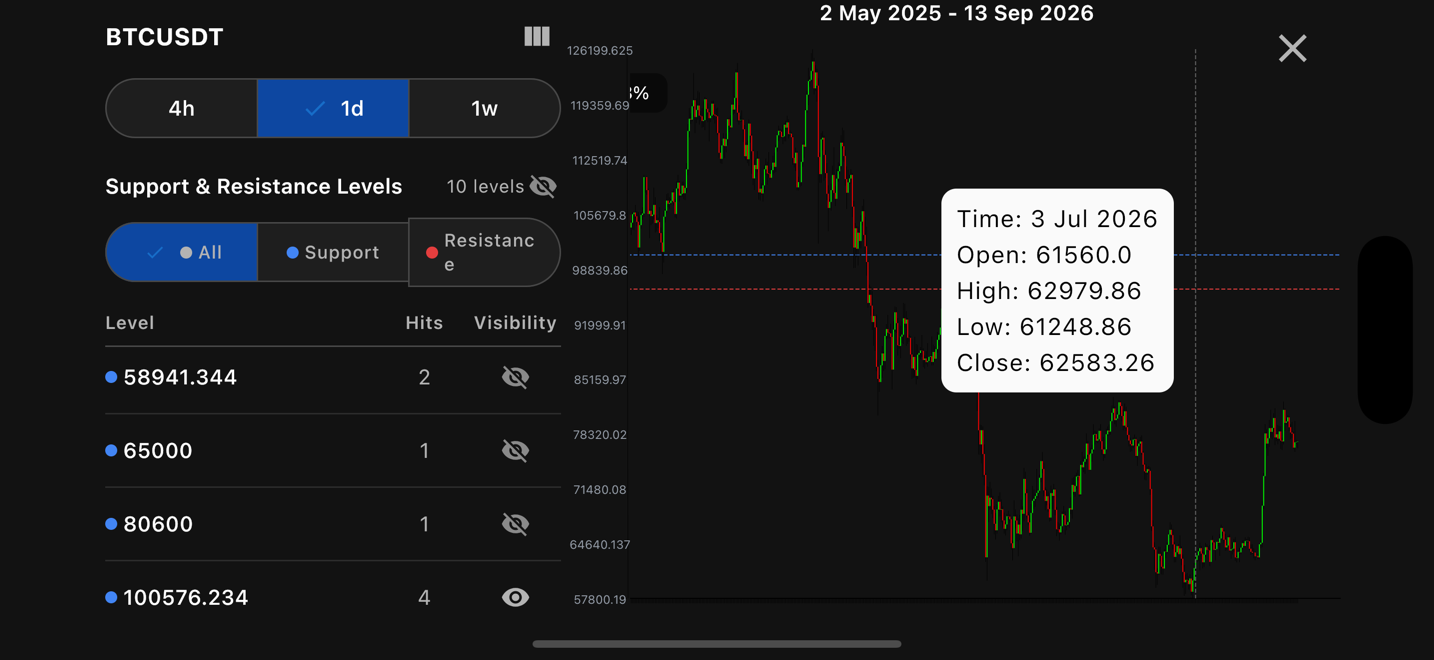
Rotate into a wider workspace with levels beside the candles — built for studying structure on a larger canvas.
Also called Crypto S&R — informational charting and market data, not trading advice.
Crypto Support & Resistance helps you analyze cryptocurrency markets with clear candlestick charts and automatic support and resistance levels. See key price levels on live market charts, explore thousands of crypto pairs, and keep your favorite coins in a personal watchlist.
Instead of guessing where levels might be, Crypto S&R calculates and plots support and resistance on the chart so you can study structure at a glance. Filter support, resistance, or both, and toggle levels on or off as you analyze.
Chart and listing data come from third-party market-data sources and may be delayed, incomplete, or unavailable. Levels are calculated from that data and can differ from other platforms. Crypto Support & Resistance is not affiliated with any exchange.
Crypto Support & Resistance is an informational charting and market-data tool. Charts, prices, and support/resistance levels are for education and market study only. They are not financial advice and not a recommendation to buy, sell, or hold any asset. Cryptocurrency markets are volatile — always do your own research.
Home, Explore, levels, and landscape — the screenshots follow your light or dark appearance.
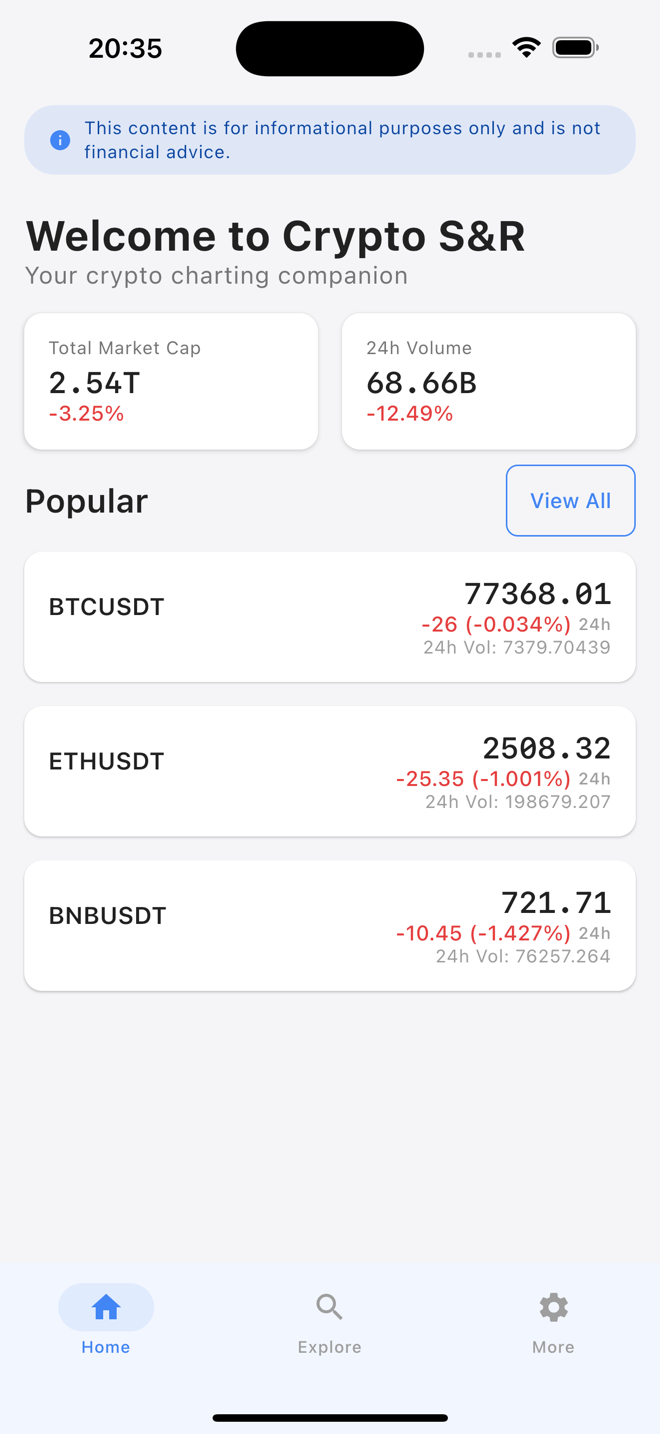
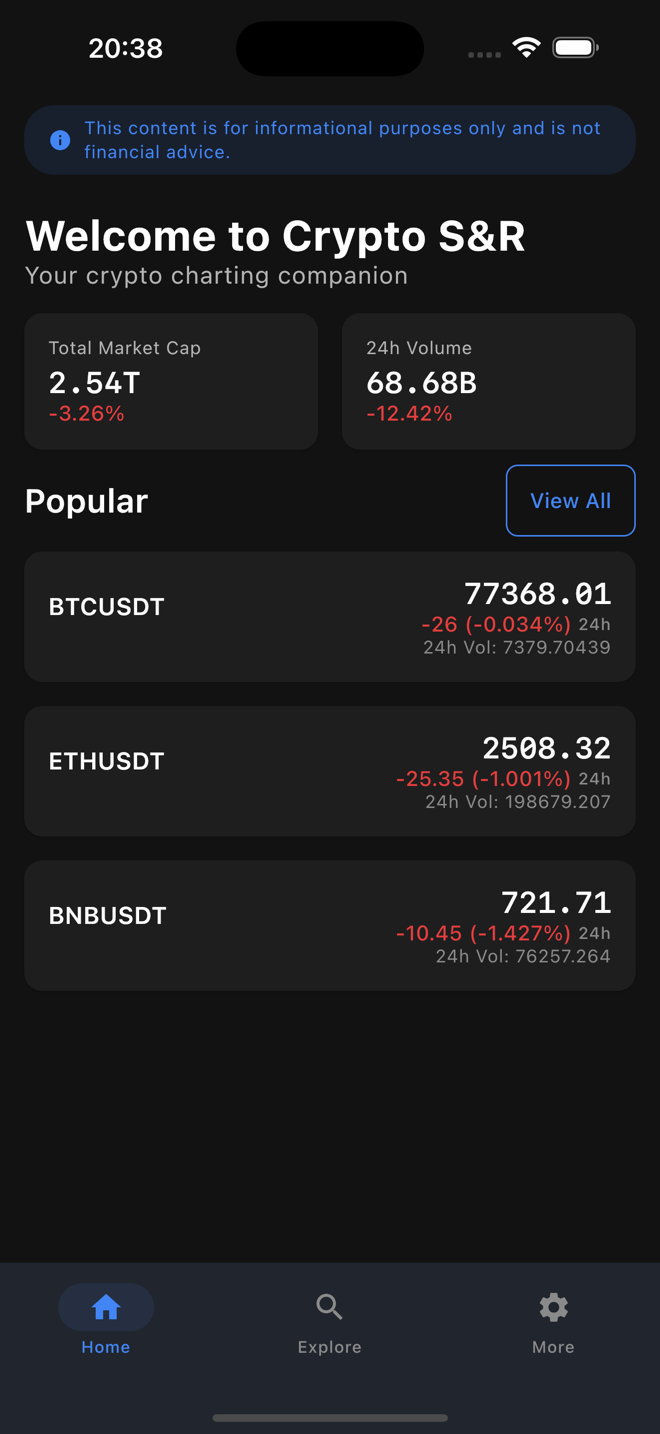
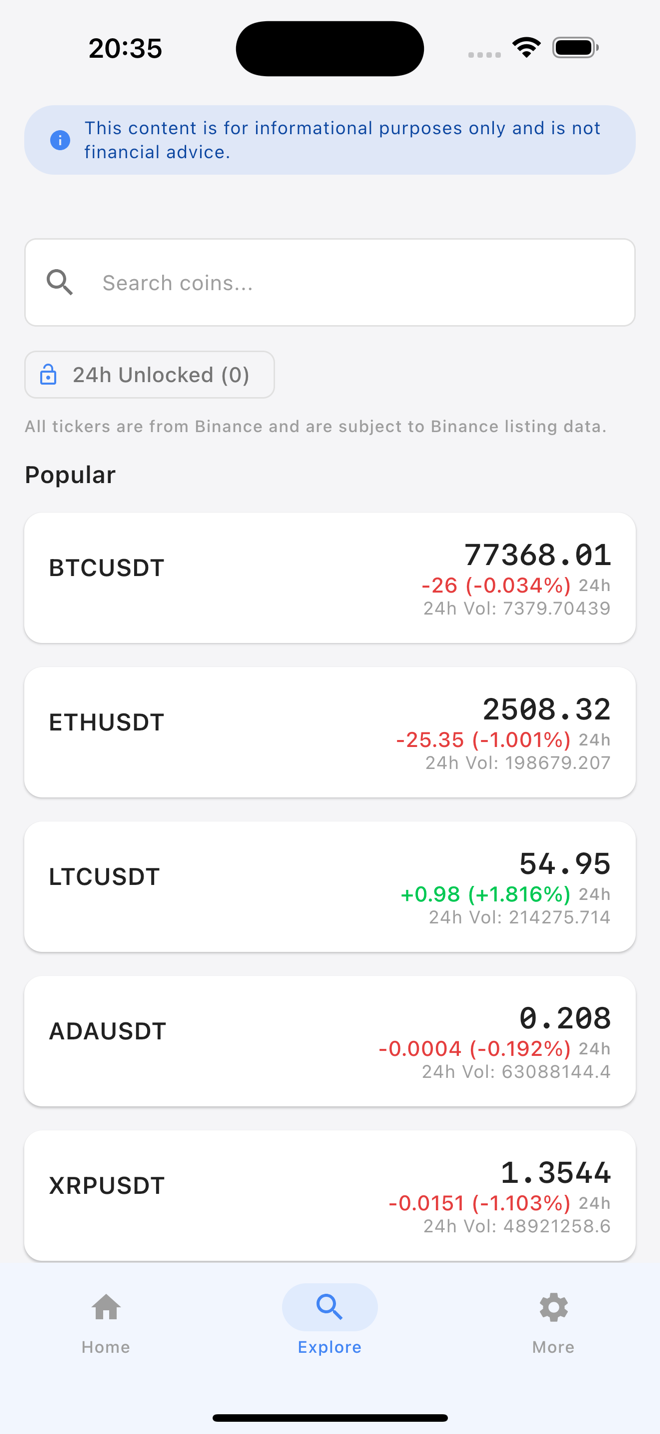
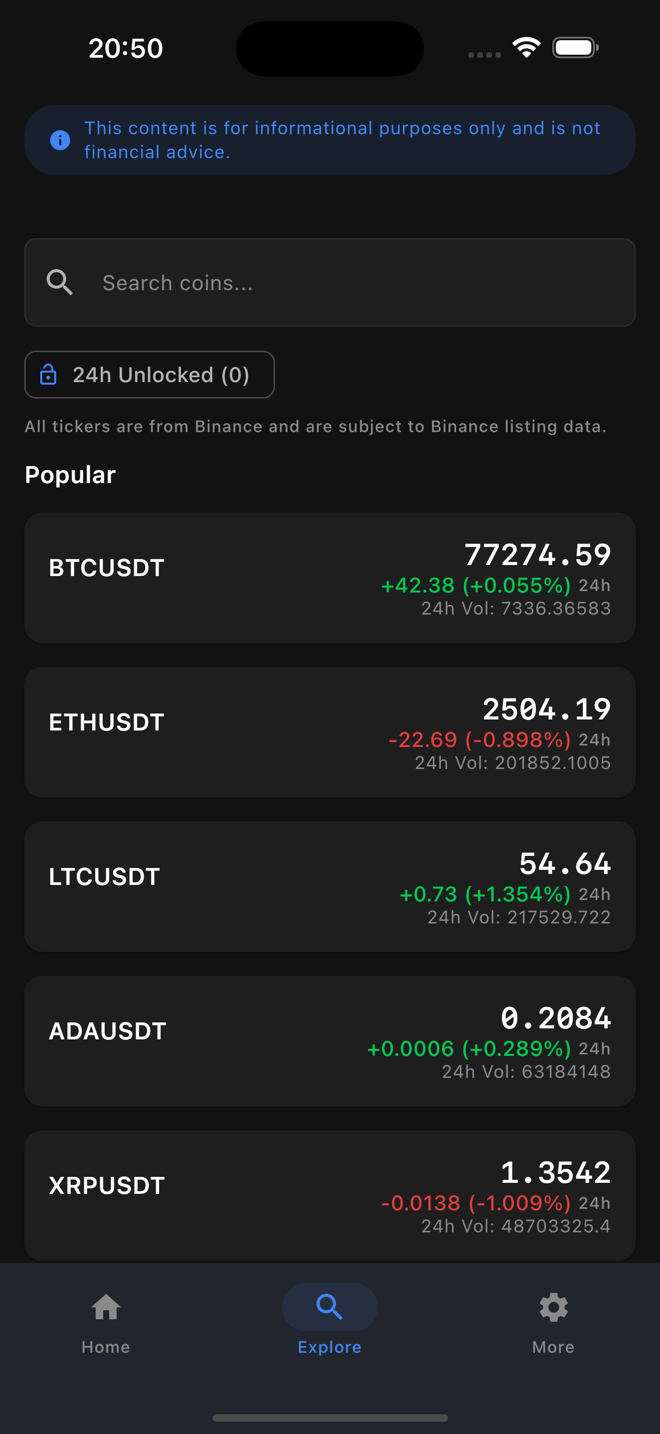
Download Crypto Support & Resistance and open a chart to see support and resistance on live crypto candlesticks.
Soon
Coming soon — currently in App Store review